plot_ca_pairing show possible codon-anticodons pairings
Usage
plot_ca_pairing(codon_table = get_codon_table(), plot = TRUE)Examples
ctab <- get_codon_table(gcid = '2')
pairing <- plot_ca_pairing(ctab)
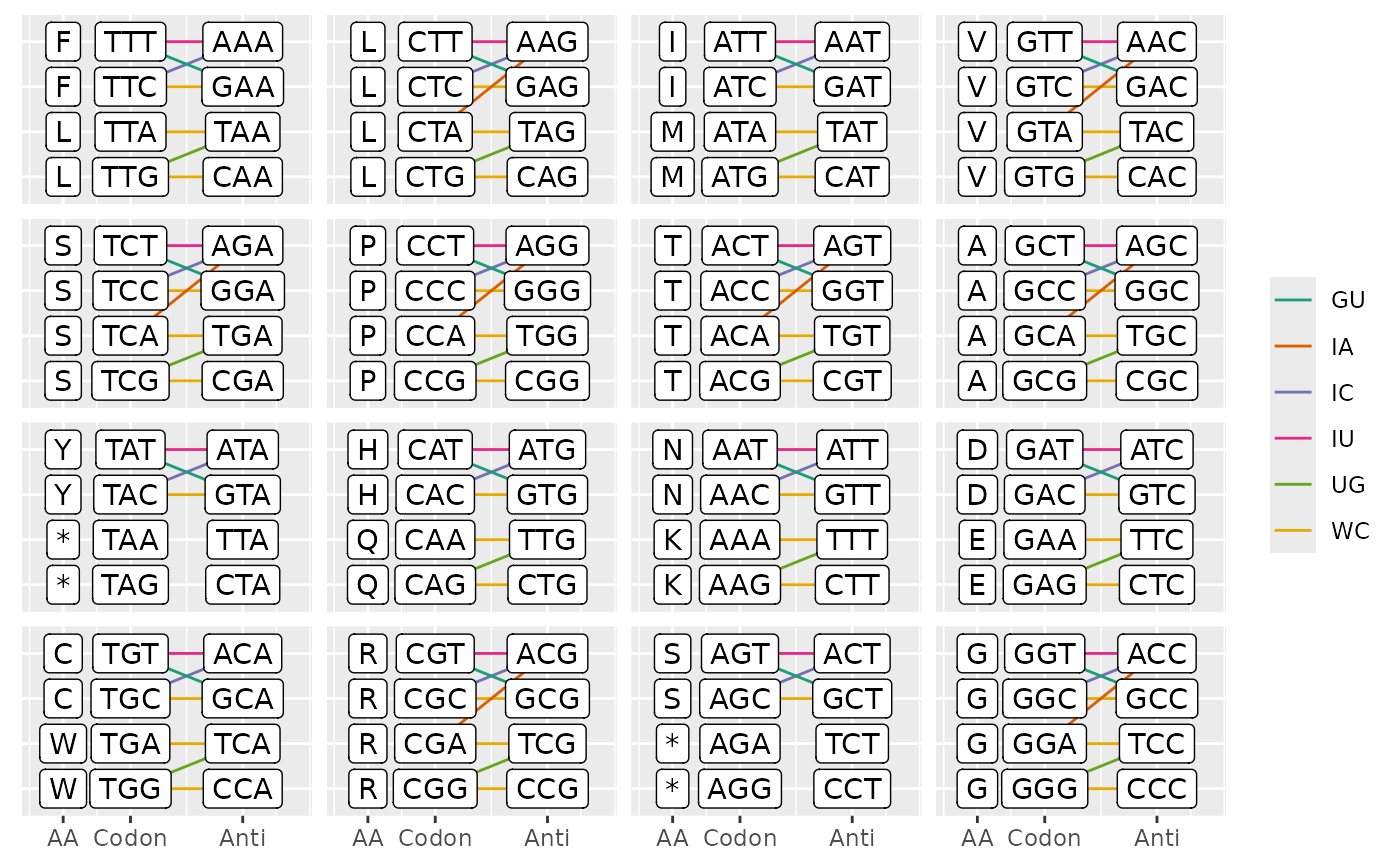 head(pairing)
#> type codon anticodon
#> <char> <char> <char>
#> 1: WC TTG CAA
#> 2: WC TTA TAA
#> 3: WC TTC GAA
#> 4: IU TTT AAA
#> 5: IC TTC AAA
#> 6: GU TTT GAA
head(pairing)
#> type codon anticodon
#> <char> <char> <char>
#> 1: WC TTG CAA
#> 2: WC TTA TAA
#> 3: WC TTC GAA
#> 4: IU TTT AAA
#> 5: IC TTC AAA
#> 6: GU TTT GAA