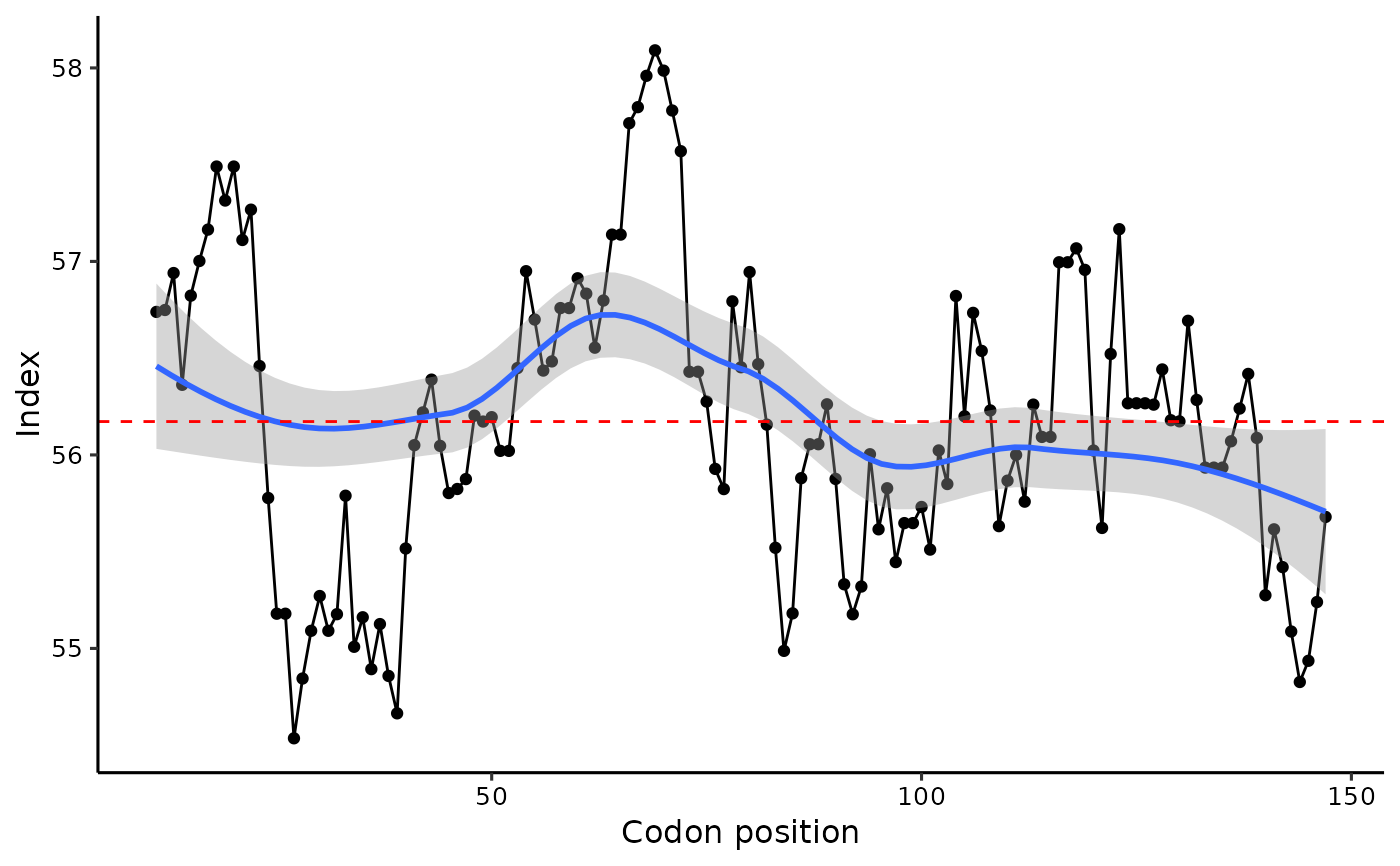
slide_plot visualizes codon usage in sliding window.
Examples
sw <- slide_apply(yeast_cds[[1]], get_enc, step = 1, before = 10, after = 10)
slide_plot(sw)

slide_plot visualizes codon usage in sliding window.
sw <- slide_apply(yeast_cds[[1]], get_enc, step = 1, before = 10, after = 10)
slide_plot(sw)
